¶ 1.7.0
¶ New features
¶ Peripheral devices integration
The following peripheral devices have been integrated into the EMS:
- Fans:
- Weiguang (Modbus RTU)
- Generic radial fan (DIO)
- Air conditioning (AC):
- Envicool MC06-50 series
- Envicool MC90
- Fire Alarm Control Panel (FACP):
- Kentec SIGMA XT f
The devices can be added within the device manager in both Cloud and Local UI.
FANS
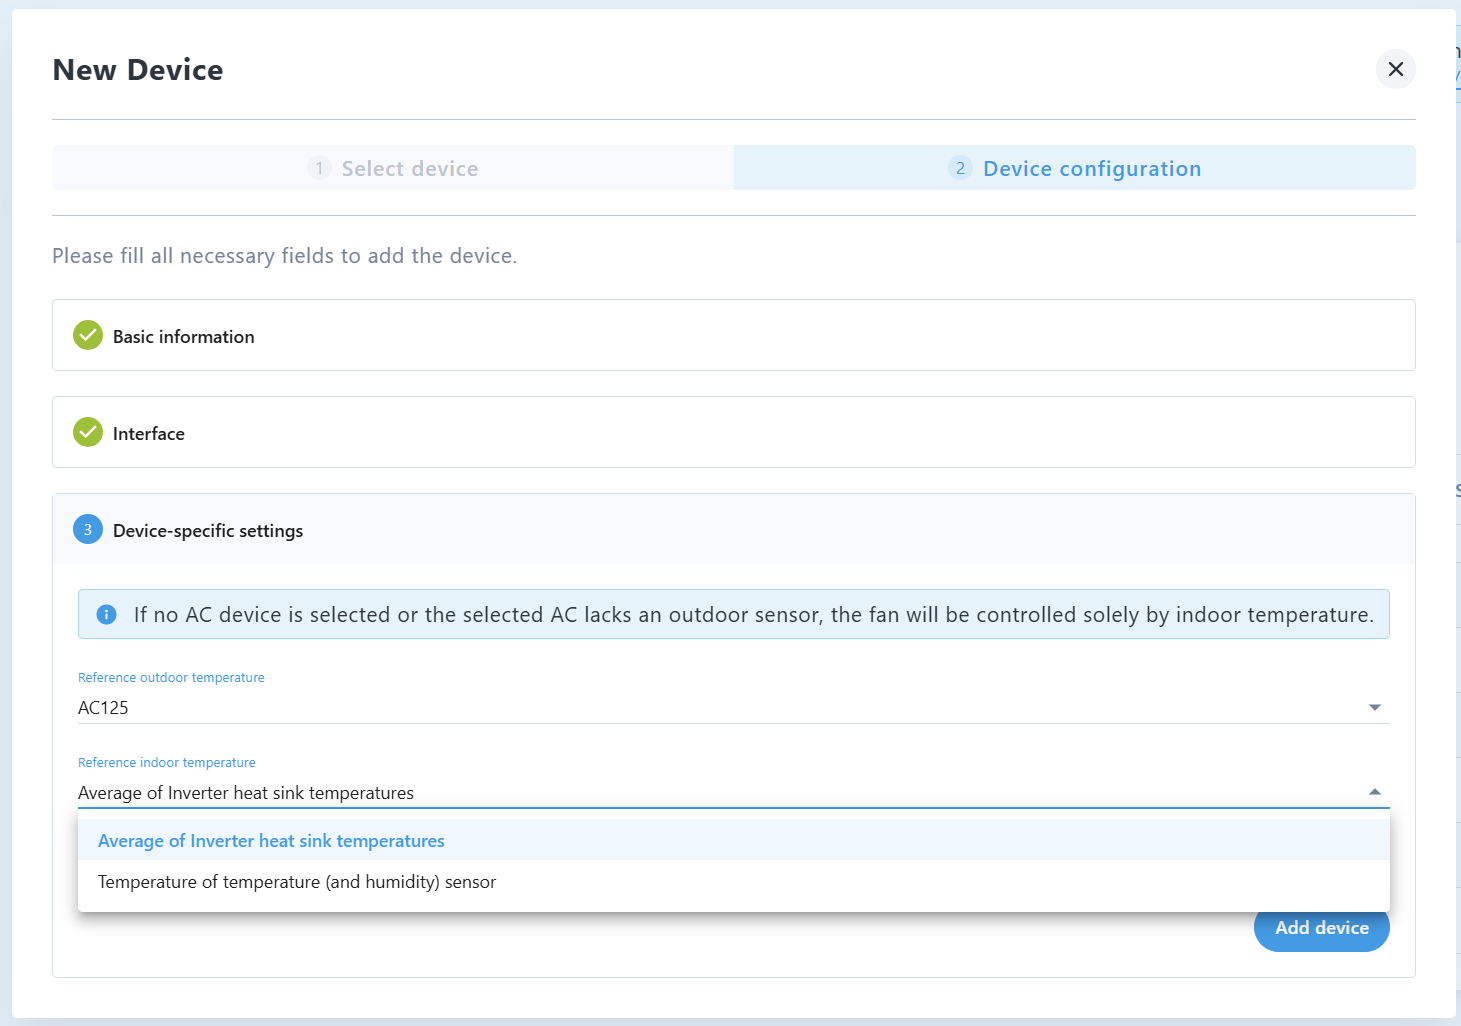
Once created, the fans are automatically controlled by the EMS based on the following temperatures:
- Indoor temperature: This can be taken from the inverters' reported cabinet temperature or a temperature and humidity sensor. This is mandatory, with the default set to the inverters' heat-sink temperature.
- Outdoor temperature: If available, it is provided by an air-conditioning system with an outdoor temperature sensor. This is optional; if not provided, the fan will be controlled only by the indoor temperature.
Note: the reference temperatures must be selected upon device creation (see below screenshot)
Control logic:
- The fan will turn on if the outdoor temperature exceeds 30°C (if outdoor temperature is available) or the indoor temperature reaches 70°C. Once started, it will run for 5 minutes.
- The fan will stop when the reference temperature drops 3°C below the threshold and the 5-minute running time has passed.
Notifications: Alerts are sent when the fan status changes or if the fan can't be controlled due to unavailable reference temperature data.
Please be aware that if a fan has been created and is linked to an Air-Conditioning and/or Temperature and Humidity sensor, the referenced devices cannot be deleted. The fan must be deleted first.
AC
The AC devices use default settings for operation, which cannot be changed in the EMS. The EMS controls the ACs based on these settings.
Alerts are sent when the AC device status changes, including error statuses and device alarms.
FACP
Notifications are sent via UI and mail when the FACP status changes, such as when it enters a fault state or a fire alarm is triggered.
¶ Changes
¶ Introduction of user-friendly notification when reports are not available
Previously, when the report service was unavailable, a technical error message was displayed in the UI. This has been replaced with a user-friendly message informing users that reports are currently unavailable.
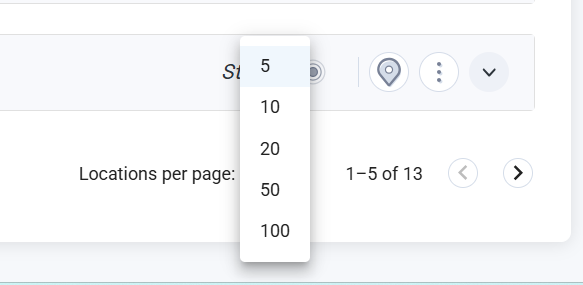
Portal pagination extended
The pagination options in the Portal have been extended, now including the options to show 50 and 100 systems in one list.
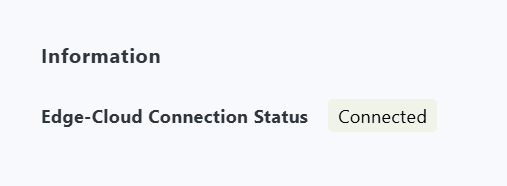
¶ System Settings Enhancements
Under System Settings → Controller → Information, the status of the connection between Edge and Cloud as well as the timestamp when the last connection occurred is now shown, when the status is Disconnected.
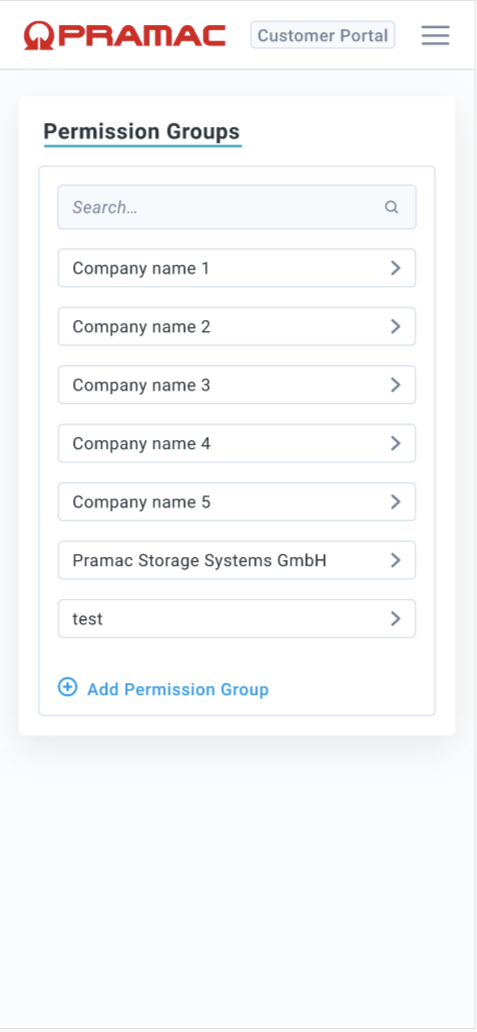
¶ Mobile View Improvements
Several changes have been made to enhance the experience on mobile devices:
- Permissions Group Page: The Edit button is now properly aligned.
- Portal Page (Notifications Section): Display issues have been corrected, ensuring proper information visibility.
- Notifications Modal: Improved layout to better fit mobile screens.
- Enhanced Mobile Usability: The following pages have been adjusted for better mobile compatibility:
- Users
- Permissions Groups
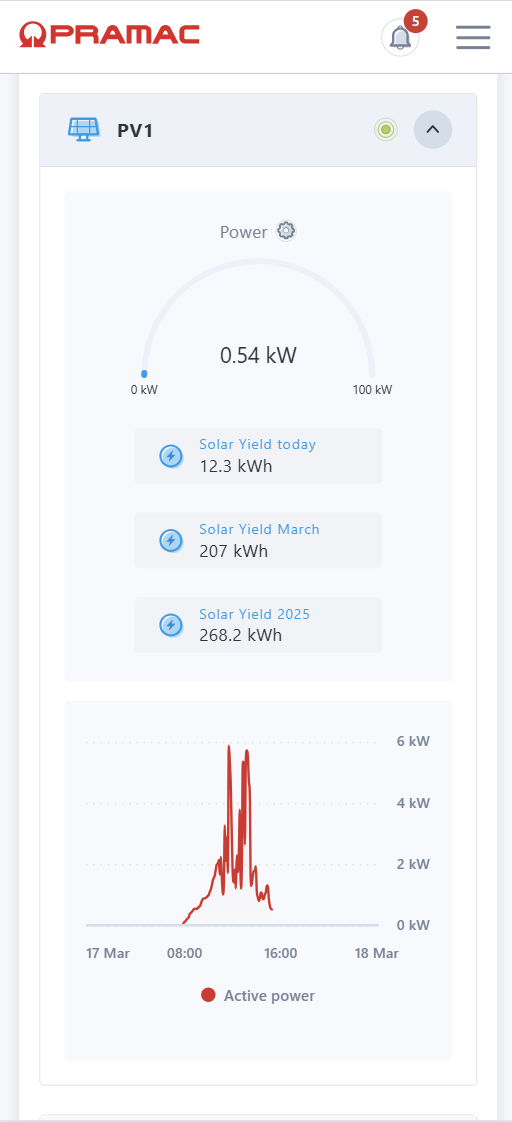
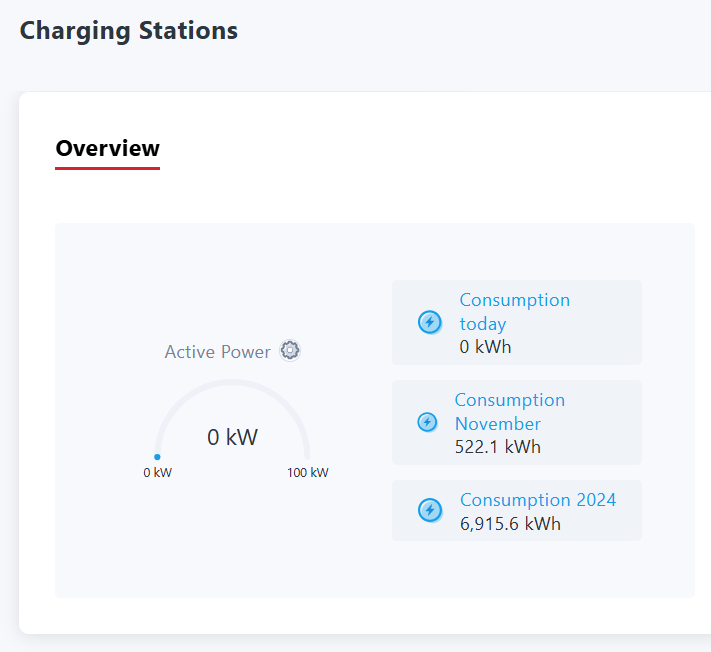
- Photovoltaic → Details
- Charging Stations → Details
- Balancing Settings
- System Settings → IT Network
- Maintenance Page
See below how some of the improved pages look like:


¶ Device Status & Notifications changes for Temperature and Humidity Transmitter
If there is no communication with the device, the status light indicator will now turn red. A system notification will be sent whenever there is a status change for this device.
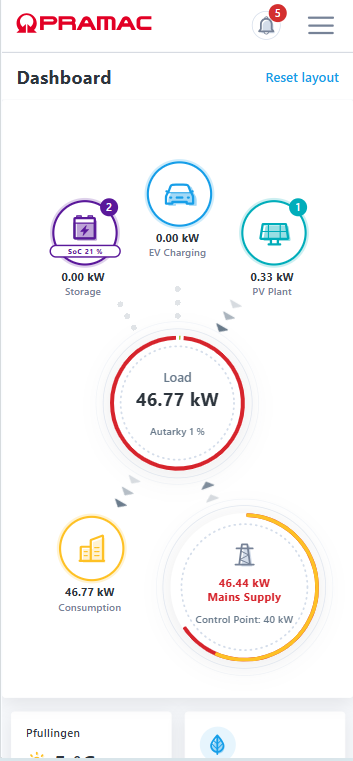
¶ Dashboard Layout Update
The ability to rearrange widgets on the Dashboard has been removed, along with the Reset Layout button. The widgets now have a fixed size and position to prevent misalignment issues.
¶ “Smart meter” label change
The “smart meter” label has been changed to “energy meter” across the application.
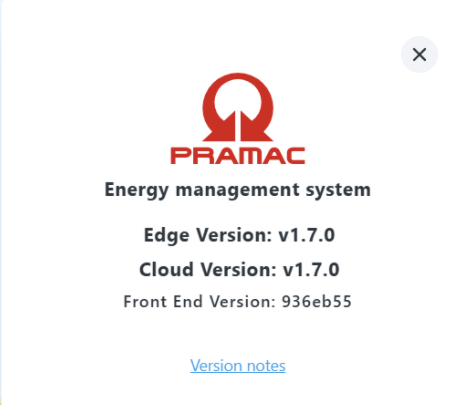
¶ Version notes
Version number and link to the current version notes is now available under Help > Version Notes. Edge version refers to the version running on the local PSEC, Cloud version to the version of the Cloud UI. Front end version is for development use only, helpful to be added to issue reports affecting the UI.
¶ Bug fixes
- The issue with the same color being used for multiple charge poles in the Charge Poles → Reports has now been resolved.
- The issue with the IBU name missing from the notification about the balancing issue has been resolved.
- The issue with the energy values for EnerCharge Charge Poles being too small has been fixed as well.
¶ v1.6.0
¶ New Features
¶ Control Point added to Multi-Use operation mode template for Peak-Shaving
The users now have the ability to set different control points for different multi-use operation tasks. To do this:
- Go to Operations Management (in Cloud or Local UI)
- Create a new multi-use task
- Within the task creation template, set the desired control point for this particular multi-use task. The value of the set Control Point is taken into account when the system is doing peak-shaving, as part of the multi-use operation.

After the release, all pre-existing multi-use operation modes in the Production systems will automatically have the Control Point set to the value the system has set under System Settings > Grid Connection Point and all operations should run the same as before.
The Control Point still present in System Settings > Grid Connection Point section is still used as the limit for EVCS Load Management, and it has been relabeled to EVCS LLM limit.
The dashboard widget will only show the Control Point when the system is doing peak-shaving.
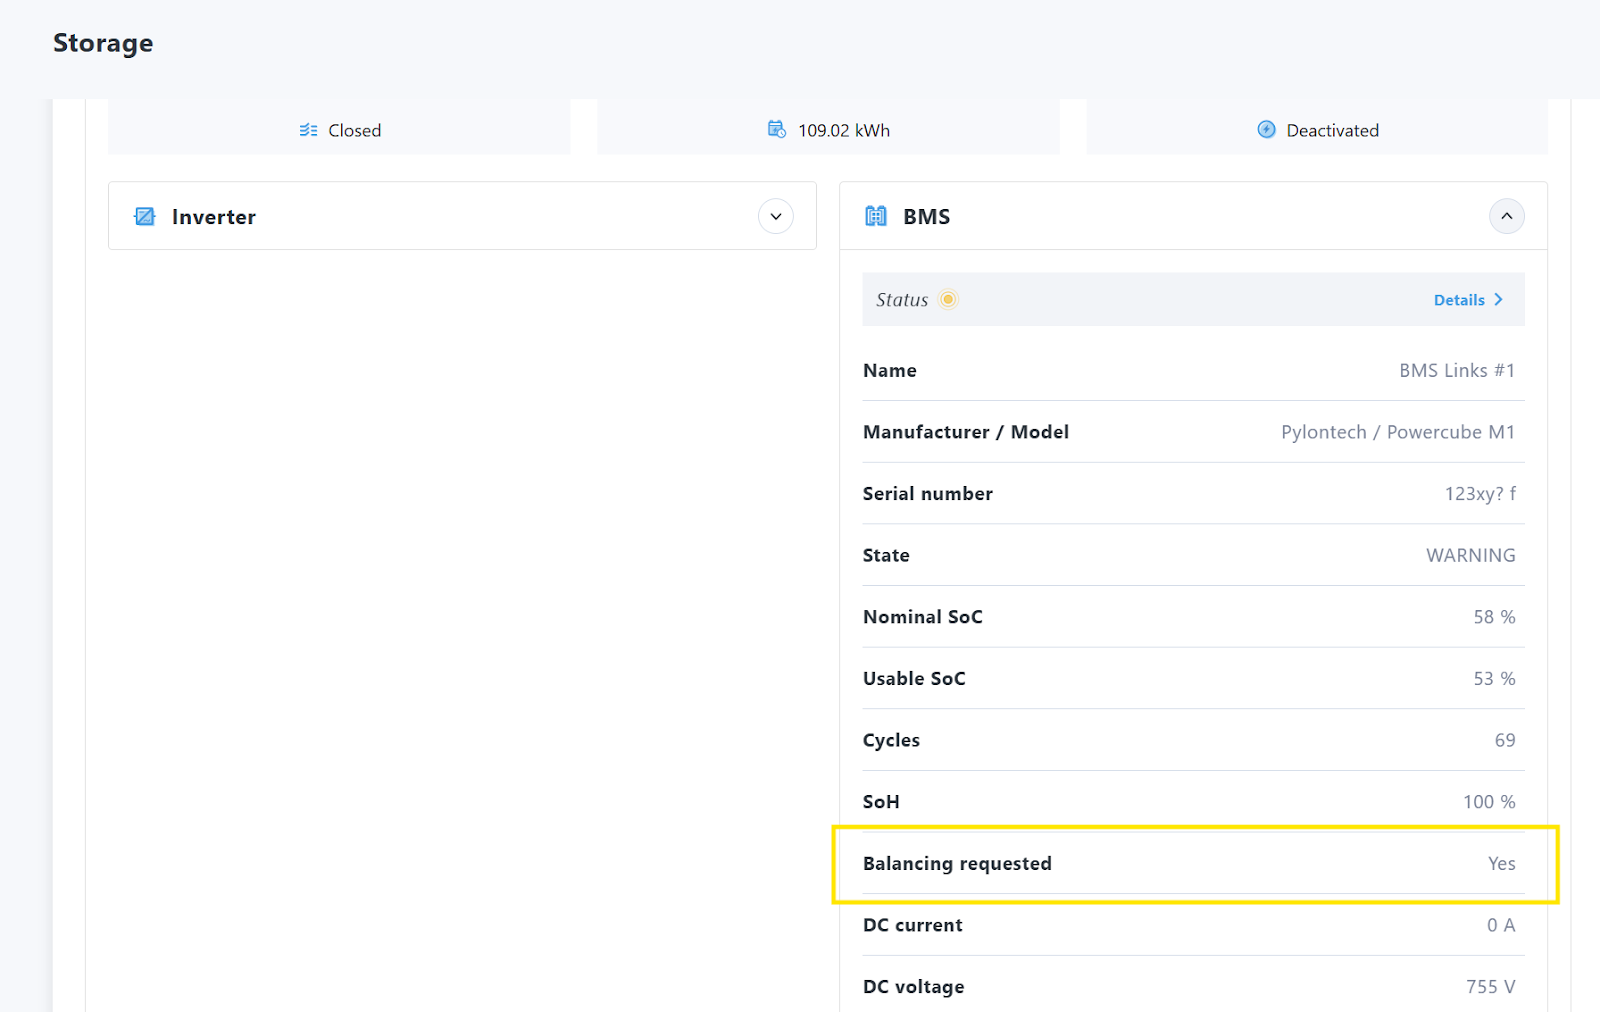
¶ Status of the balancing request register displayed under Storage > BMS details for Pylontech BMS
EMS users can see within the EMS UI > Storage > BMS details the status of the BMS in regard to the need of balancing.
¶ Temperature and Humidity sensor integration
Within the EMS, it is now possible to add a temperature and humidity sensor. Its read values (temperature and humidity) will be stored in the EMS local and Cloud database. At this moment in time, these values will not be displayed in the EMS UI. Supported devices:
- Manufacturer: ASAIR, Model: FG6485A
- Manufacturer: MiEnergy, Model: ME-WS-5W
¶ Changes
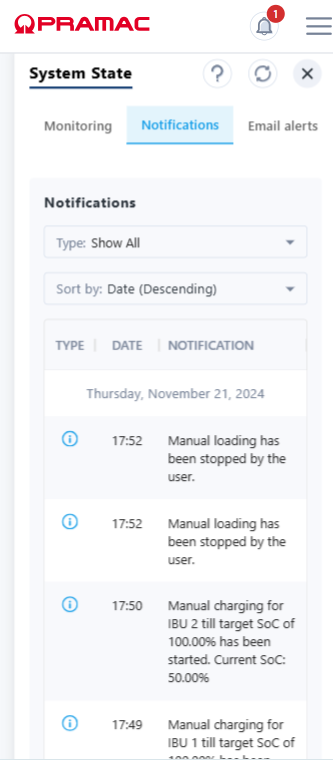
¶ Improved system notifications for manual charging/discharging operations
- The system notification which expresses that manual charge or discharge has been stopped, contains the name of the corresponding IBU.
- The system notification contains the power value of the charging/discharging operation.
- The system notification correctly shows when manual discharging has been stopped.
- There are proper messages for English and German.
¶ Extended list of supported Alpitronic models
The EMS now can integrate the following EVCS models from the manufacturer Alpitronic:
- HYC 200
- HYC 200 (100 kW / 1x CCS2)
- HYC 200 (100 kW / 1x CCS2 / 1x CHAdeMO)
- HYC 200 (100 kW / 2x CCS2)
- HYC 200 (200 kW / 1x CCS2)
- HYC 200 (200 kW / 1x CCS2 / 1x CHAdeMO)
- HYC 200 (200 kW / 2x CCS2)
- HYC 400
- HYC 400 (100 kW / 1x CCS2)
- HYC 400 (100 kW / 1x CCS2 / 1x CHAdeMO)
- HYC 400 (100 kW / 2x CCS2)
- HYC 400 (100 kW / 2x CCS2 / 1x CHAdeMO)
- HYC 400 (100 kW / 3x CCS2)
- HYC 400 (200 kW / 1x CCS2)
- HYC 400 (200 kW / 1x CCS2 / 1x CHAdeMO)
- HYC 400 (200 kW / 2x CCS2)
- HYC 400 (200 kW / 2x CCS2 / 1x CHAdeMO)
- HYC 400 (200 kW / 3x CCS2)
- HYC 400 (300 kW / 1x CCS2)
- HYC 400 (300 kW / 1x CCS2 / 1x CHAdeMO)
- HYC 400 (300 kW / 2x CCS2)
- HYC 400 (300 kW / 2x CCS2 / 1x CHAdeMO)
- HYC 400 (300 kW / 3x CCS2)
- HYC 400 (400 kW / 1x CCS2)
- HYC 400 (400 kW / 1x CCS2 / 1x CHAdeMO)
- HYC 400 (400 kW / 2x CCS2)
- HYC 400 (400 kW / 2x CCS2 / 1x CHAdeMO)
- HYC 400 (400 kW / 3x CCS2)
¶ Bug fixes
- BMS status now remains correct after deleting the IBU the BMS was part of.
- The issue with the balancing not working has been resolved.
- The issue with the BMS details showing online although the BMS was in error state has been fixed as well.
¶ v1.5.0
¶ New Features
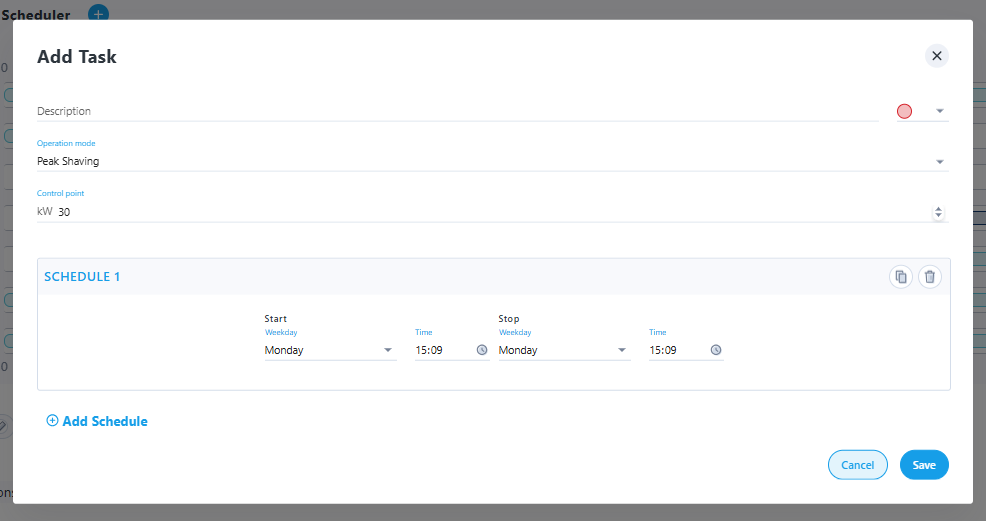
¶ Peak shaving control point can now be configured within the peak shaving operation mode template
Users can now define different control points for each Peak Shaving operation mode. To do this:
- Navigate to Operations Management.
- Create a new task of type Peak Shaving.
- Specify the desired control point (e.g. 30 kW) in the designated input field
- Save the task
Important Notes:
- Pre-existing modes: All existing Peak Shaving operation modes will default to the control point defined under System Settings → Grid Connection Point.
- EVCS Load Management Limit: The control point under System Settings → Grid Connection Point remains the upper limit for EVCS Load Management.
- Multi-Use operation mode: The integration of control points into the Peak Shaving template is not yet available for the Multi-Use operation mode. In this mode, the global control point still applies as both the EVCS Load Management limit and the Peak Shaving control point.
This update gives you greater flexibility to tailor Peak Shaving to your specific operational needs
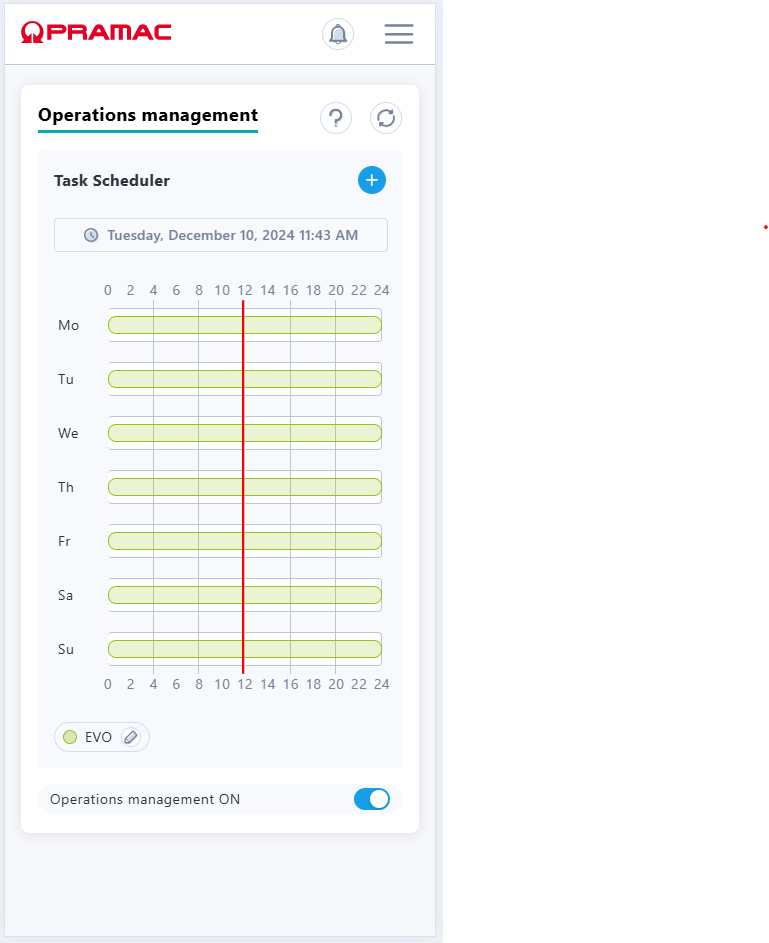
¶ Mobile Accessibility for Operations Management
The Operations Management page is now fully functional on mobile devices.
Users can now seamlessly access the EMS, view details, and make changes in Operations Management directly from their mobile phones.
This enhancement ensures greater flexibility and accessibility for on-the-go operations.
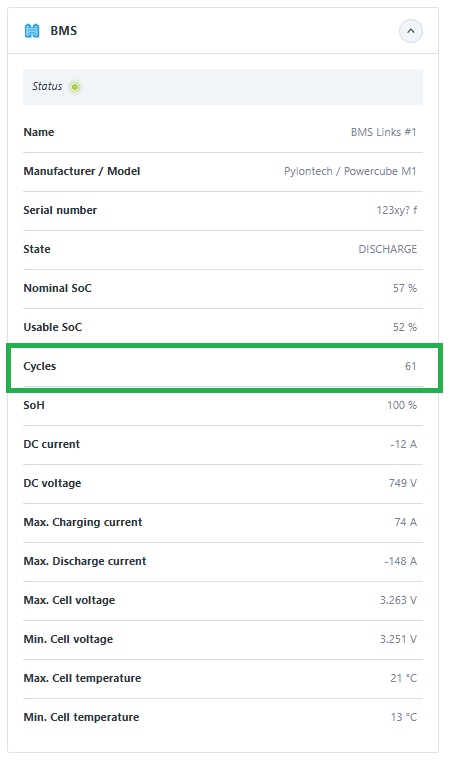
¶ Battery Cycle count added to BMS Details
The BMS Details section now includes the total number of full battery cycles for batteries connected to the respective BMS.
To view this information, navigate to Storage → IBU → BMS, where the battery cycle count is now displayed. This update provides better insights into battery usage and performance.
¶ Pramac Battery Inverter 90K Integration
The Pramac Battery Inverter 90K (PBI 90K) is now supported and can be added via the Device Manager for use within the EMS.
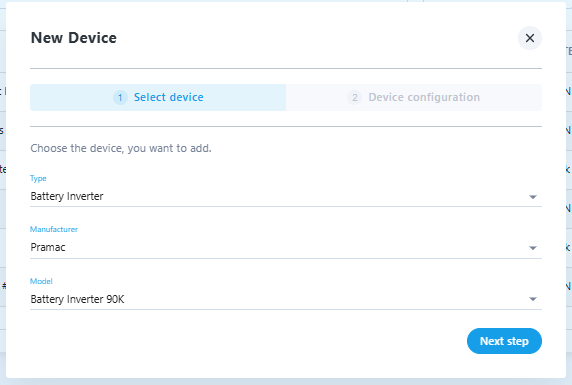
This enhancement expands compatibility and functionality within the system.
¶ Pylontech Powercube M5 BMS Integration
The Pylontech Powercube M5 BMS is now supported and can be added via the Device Manager for use within the EMS.
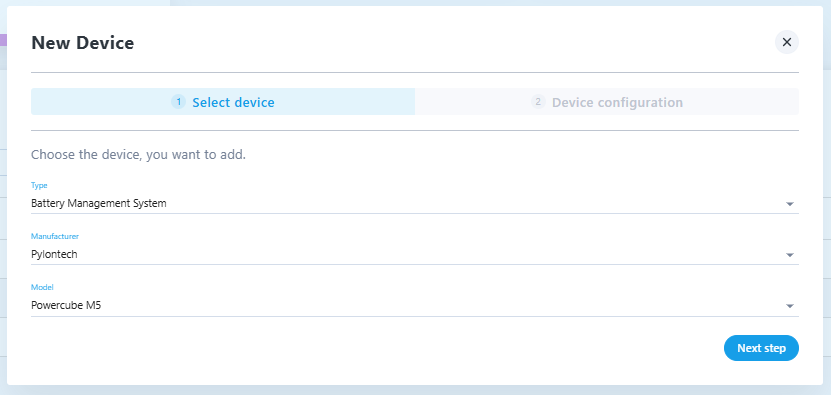
This enhancement expands compatibility and functionality within the system.
¶ Bug fixes
- German Translations: Added to the Email Alerts section under System Settings → System State → Email alerts
- Inverter Error Classification: Multiple inverter errors previously labeled as "Unknown Error" have been corrected in both notifications and the Inverter Error Details section.
v1.4.21
¶ New Features
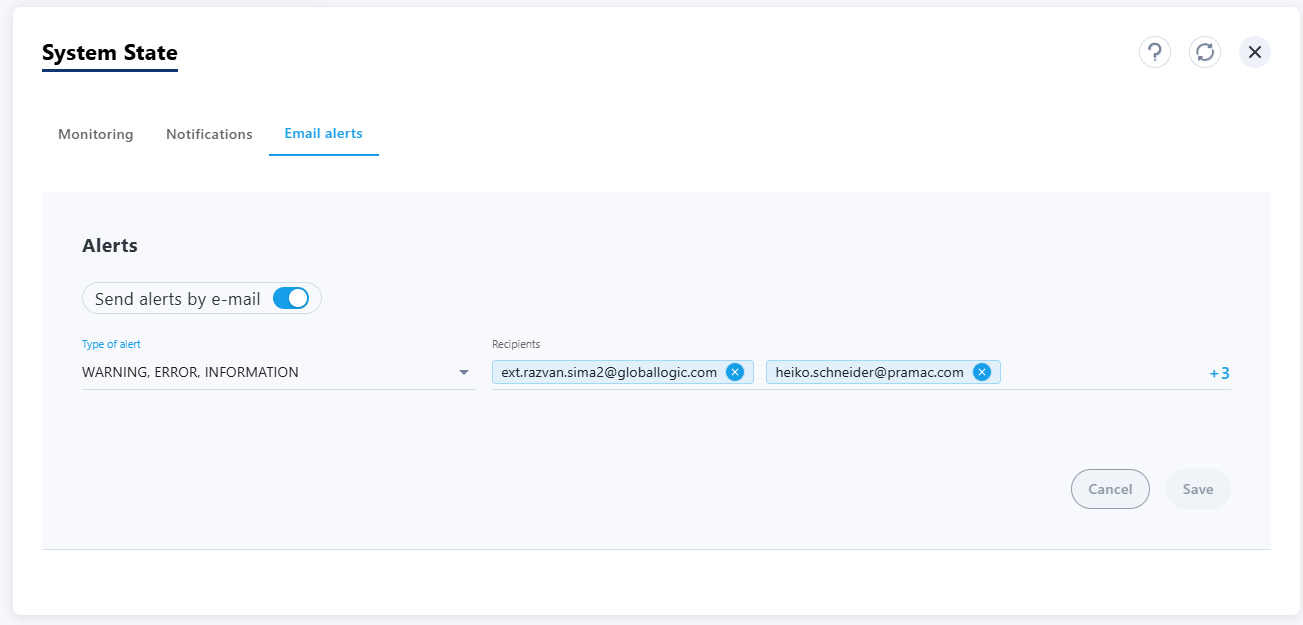
¶ Ability to receive system notifications via email
EMS users can opt to receive system notifications by email. This can be enabled from System Settings > System State > Email Alerts. Users have the option to choose the type of email alerts they wish to receive (information, warning, or error), specify the email addresses of the intended recipients, and save their selections. For each selected notification type, when the system generates a notification, all designated recipients will receive an email. Please refer to the sample screenshot below for reference:
¶ New Device Integration: SMA Data Manager M
The SMA Data Manager M can now be used within the EMS as a smart meter, specifically for photovoltaic systems. Within the EMS, it functions like any other smart meter for PV. Power and energy readings from the device are being displayed in various areas of the EMS where photovoltaic data is relevant: Dashboard, Reports, Photovoltaic (Overview, Details, Reports).
¶ Notifications for inverter and BMS errors
EMS users will receive notifications for inverter and BMS errors within the UI as well as via email.
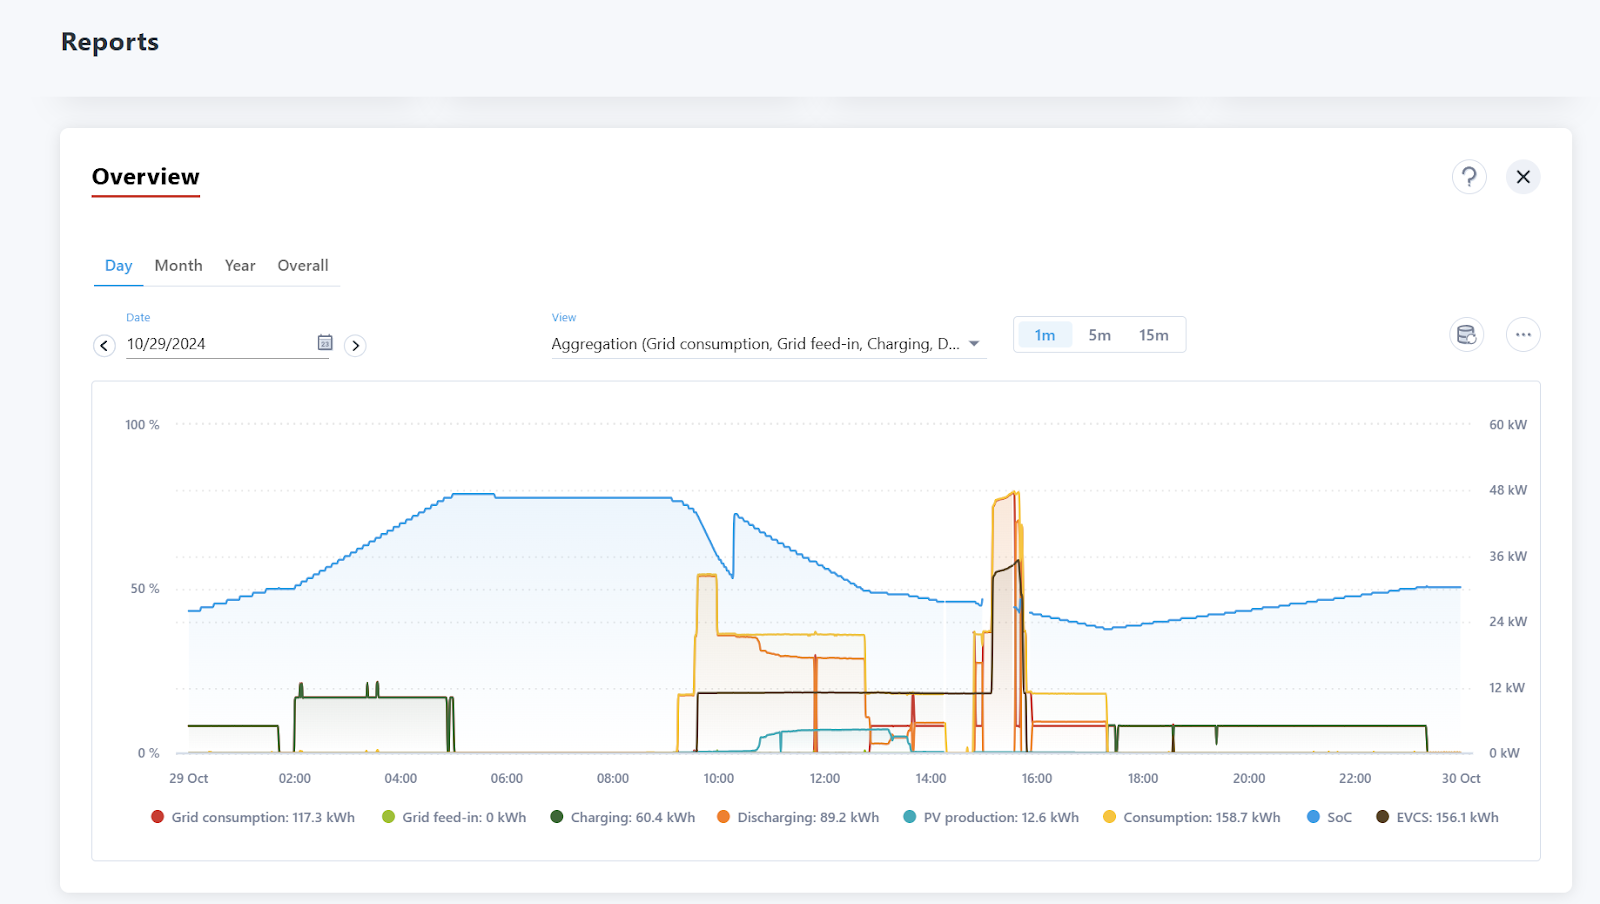
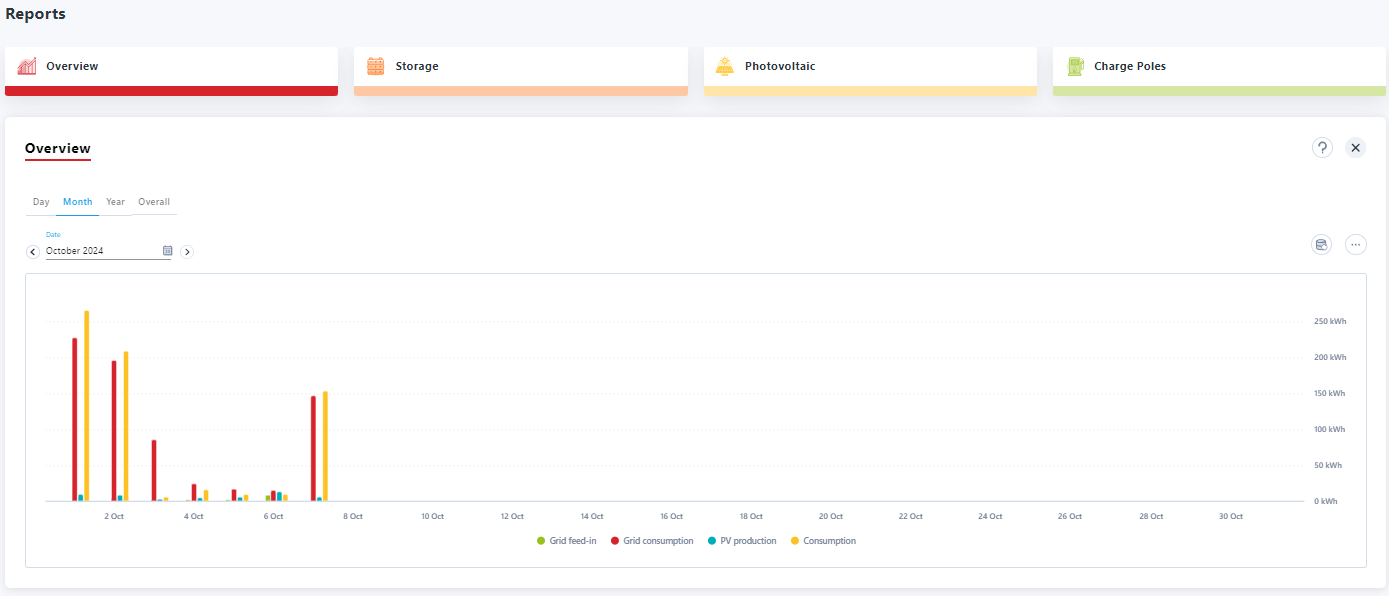
¶ Daily energy values displayed next to the legend in the Overview chart
EMS users are now able to see the daily energy values displayed next to the legend in the Reports > Overview chart for the following data points:
- Grid consumption
- Grid feed-in
- Charging
- Discharging
- PV production
- Consumption
- EVCS
The values for Grid feed-in, Grid consumption, PV production, and Consumption will continue to be displayed if the user selects Month, Year, or Overall reports.
Please note that these values are refreshed hourly.
Please refer to the sample screenshot below for reference:
Changes
¶ REST API (Cloud + local): Control endpoint updated
The Control endpoint has been updated so that:
- If a charge request exceeds the maxChargeLimit, the system charges at the maxChargeLimit and counts the request as valid, extending the 5-minute period for further requests.
- If a discharge request exceeds the maxDischargeLimit, the system discharges at the maxDischargeLimit and also counts the request as valid, extending the 5-minute period for further requests.
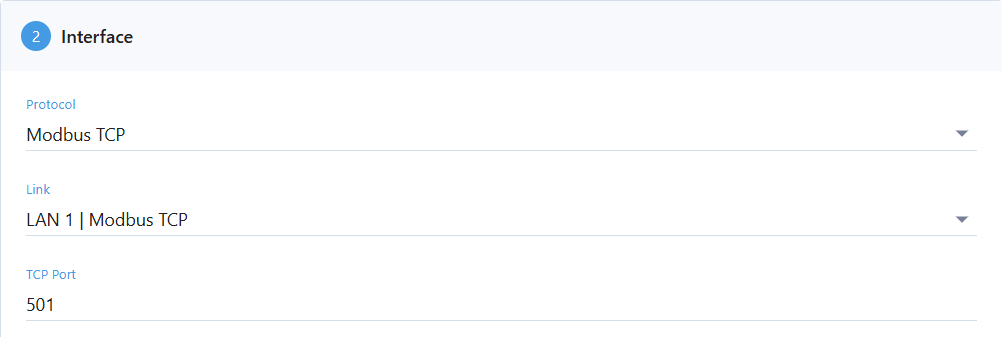
¶ Allow to enter a TCP port for TCP connected devices over UI
When a TCP connected device is being created or updated in the EMS, the user can now enter a TCP port number under the Interface section in order to be able to add devices which do not operate on the standard port.
See below image for reference:
¶ Enhanced mobile views for pages: Dashboard, Notifications and Devices
The Dashboard page, when used on a mobile device, has been updated to show the energy monitor, similar to the desktop version. See screenshot below:
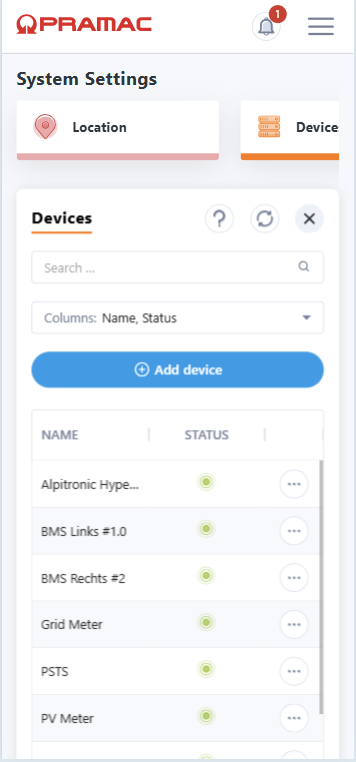
The Notifications and Devices pages have been also updated to better suit the mobile device screen size. Please see the below screenshots for reference:
¶ Notification types
The Notifications page now displays the type of the notification which are either:
- Error
- Warning or
- Information
Until this change, every notification was of type “Information”.
¶ Carlo Gavazzi smart meter setup - Note
The below note appears when a Carlo Gavazzi smart meter is created. Without setting the proper application within the settings of the device, the functionality of the meter readings cannot be assured.

¶ Reports show only PV values higher or equal to zero
In the Reports section, the charts have been revised to display only PV production values that are zero or greater. Any values that were previously negative will now be represented as zero.
¶ Bug fixes
¶ Alpitronic HYC EVCS - energy data values corrected
The Alpitronic HYC EVCS data has been updated for accuracy, with a correction factor of 10 applied. As a result, the values displayed in the Reports and Charging Stations sections for Alpitronic HYC EVCS will now reflect the correct figures.
Example:
¶ EnerCharge EVCS - energy data values corrected
The way energy data from EnerCharge EVCS is read from the devices has been corrected. As a result, the values displayed in the Reports and Charging Stations sections for EnerCharge EVCS will now reflect the correct figures.
¶ Inverter details: grid frequency shown with decimal places
The display of grid frequency value, under Storage > Inverter details has been updated to have two decimal places. Before this change, the value was displayed without the decimal places.
¶ Autarky set to 100 on negative load
Before this change, when the load value was negative, the autarky was displayed as zero. Now, when the load is negative, autarky is 100%, this being visible on the dashboard.
v1.3.9
¶ New Features
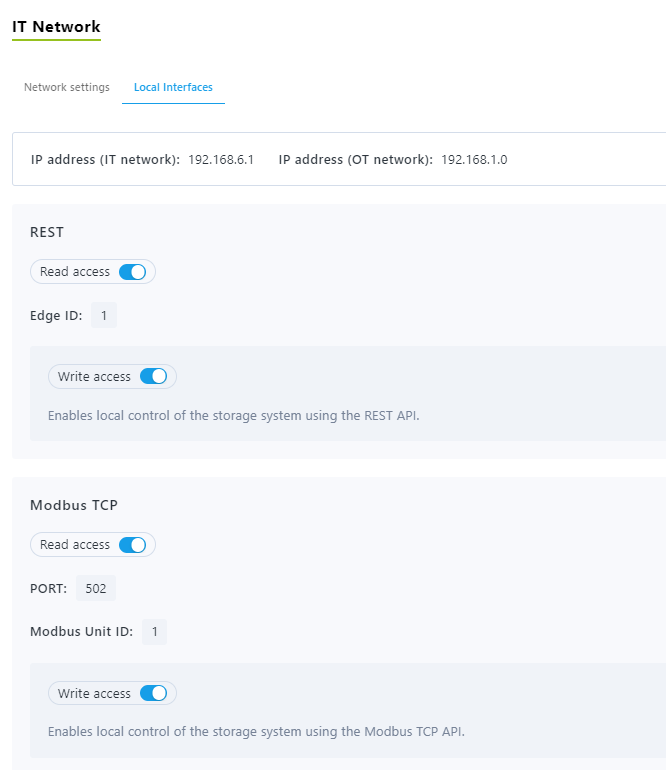
Local Modbus TCP interface
The EMS offers the capability to interact with the PSEC via a new local Modbus interface. This feature allows reading and writing certain registers. For details, please refer to the technical documentation.
In order to offer an enhanced user experience when interacting with the EMS for setting up local interfaces, the previously named Local API tab under System Settings > IT Network is now called Local Interfaces and it presents information and options on the preexisting Local REST API as well as the new local Modbus interface. The information and the controls for the REST API have not changed. A new sub-section was added for information and controls on the Modbus interface. In order to use this interface for reading registers, the Read access toggle needs to be enabled. In order to use this interface for writing registers, the Write access toggle needs to be enabled and current operation mode must be External Control.
The page now looks like in the screenshot below:
New UI for Inverter and BMS including error states
In order to enhance the user experience and to provide the place where to display Inverter and BMS errors, under Storage > Details there is an updated user interface that displays together (under the Status page) the information about the Inverter and the BMS as well as the devices states. See a sample screenshot below:

The BMS, Inverter and Settings tabs have been removed. The Maintenance tab remains as before.
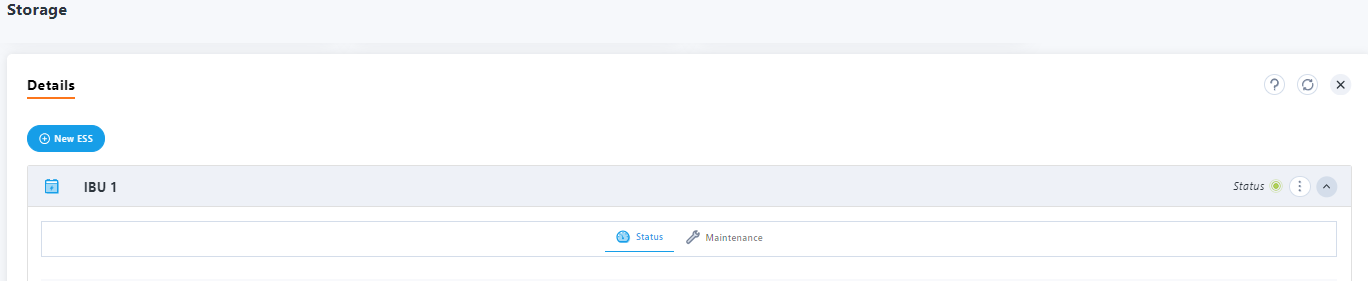
In case of errors, near the status of the Inverter or BMS, there is a Details button displayed.
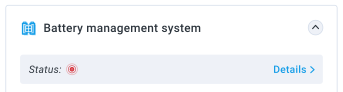
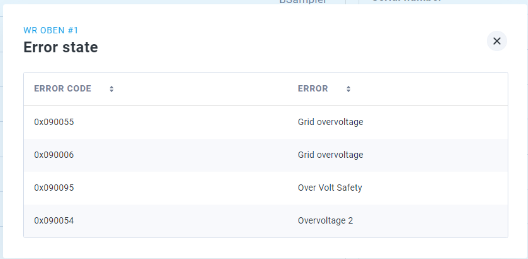
When clicked, a pop-up window is displayed, listing the current errors present in the Inverter or the BMS. See sample screenshots below:
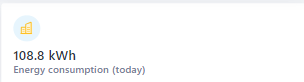
Introduction of energy consumption values in the dashboard and report charts
The EMS dashboard now has a new widget that displays the energy consumption of the day (up until now). See sample below:
Also, in the Overview reports (under the Reports section of the EMS), in the Month, Year and Overall reports, the Consumption data is displayed. See sample below:
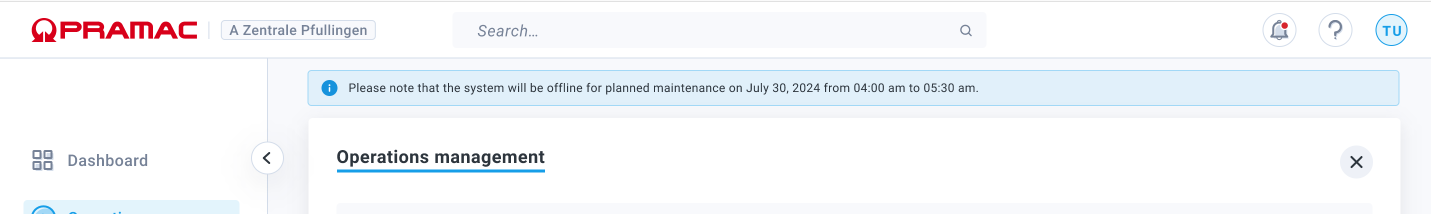
Ability to announce planned maintenance in the UI
The EMS now supports informational messages such as announcing planned maintenance time. When enabled, these messages will be shown on each page of the EMS, in the Portal and Edge Cloud UI as well. See below a sample screenshot:
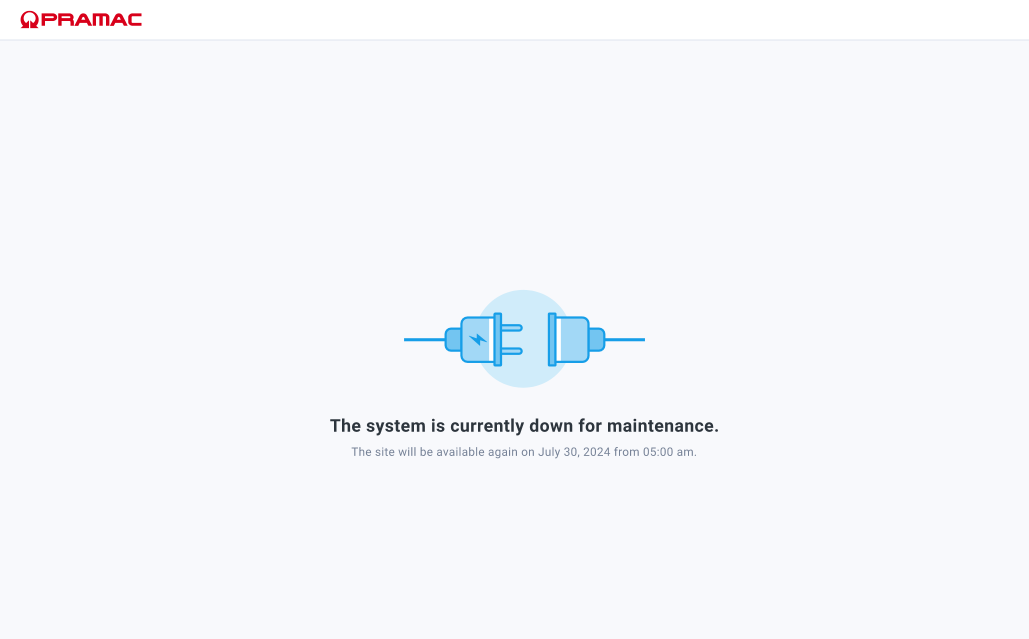
During downtime, when the users will access the EMS, they will be redirected to a maintenance page informing them about ongoing maintenance work. The maintenance page looks like this:
¶ Changes
Cycle loop optimization
Improved control loop to reduce cycle time from ~5 seconds to 2-3 seconds (depending on the grid meter communication interface and protocol).
Performance enhancements
The EMS performance and overall stability has been improved.
¶ Bug Fixes
Cloud UI - Edge
The Photovoltaic > Details page now displays the status of the PV meter correctly, being consistent with the status under Devices list.
Local edge
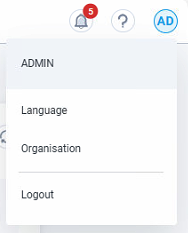
In the Local edge, under User Menu, the My Profile menu item was removed and the missing Language menu item was re-added.